

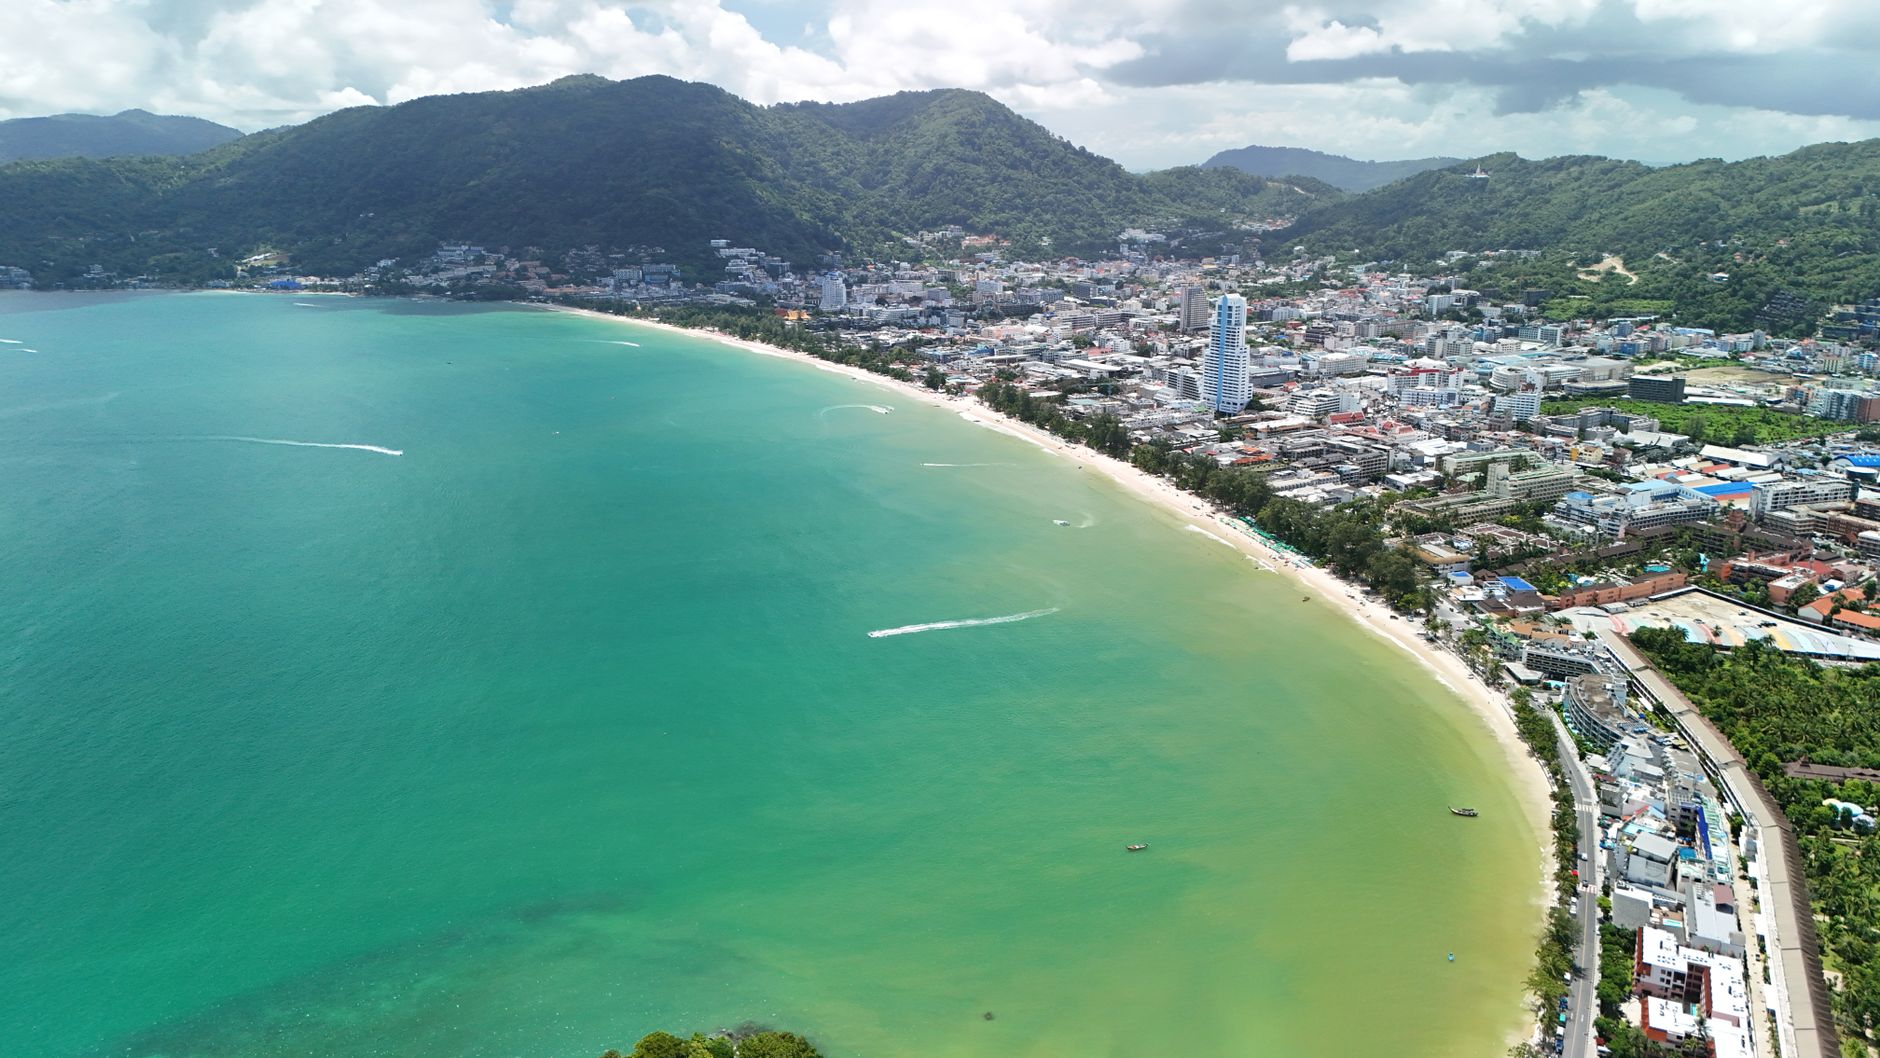
Price spreads between condominiums and villas on Phuket reach 40-60% depending on district. Based on our Q1 2026 data sets, the median asking price for condominiums in Layan sits at approximately 145,000-185,000 THB per sq m, while a comparable product in Rawai can be acquired for 75,000-105,000 THB per sq m. That gap represents a meaningful difference in capital outlay and, critically, a non-proportional difference in rental income potential. We monitor seven key districts across Phuket's western and southern coastlines. Each carries a distinct buyer profile, rental seasonality pattern, and new-supply pipeline. The analysis below is grounded in data our team collects on the ground.
Quick answer
- Most expensive district in 2026: Layan, with a median condominium asking price of approximately 165,000 THB per sq m (based on our estimates)
- Most affordable of the seven: Rawai, median at approximately 85,000 THB per sq m
- Fastest year-on-year price growth: Bang Tao, where we estimate 8-12% y/y in the new-project segment as of Q1 2026
- Highest short-term rental occupancy: Kamala and Surin, at 72-78% during peak season (November through April), per our estimates
- Best price-to-beach-proximity ratio: Karon, though new supply is limited (4 active construction sites, Q1 2026 count)
- Most constrained new supply: Nai Harn, with only 2 projects under construction totalling approximately 120 units
Options and scenarios
Scenario 1: investor targeting the highest short-term rental yield
For this objective, our analysts focus attention on Bang Tao and Kamala. Bang Tao hosts the island's largest cluster of luxury resort infrastructure (the Laguna Phuket complex), which sustains a consistent flow of premium tourists and provides an established rental-management ecosystem. Based on our estimates, gross rental yield for condominiums in the 40-60 sq m range in Bang Tao runs at approximately 5.5-7.0% per year before taxes and management fees.
Kamala, located roughly 6 km to the south, delivers a comparable yield at a slightly lower entry price point - median asking price around 120,000-140,000 THB per sq m. The dominant tenant profile across both districts is the premium leisure traveller and families on extended winter stays. Peak-season occupancy exceeds 75%; low-season occupancy (May through October) falls to approximately 35-45%, which pulls the annual average down considerably and must be factored into any yield projection.
Scenario 2: investor with a budget under 3 million THB targeting capital appreciation
Rawai and Nai Harn are the districts where a studio of 30-35 sq m in a new project can still be acquired for 2.5-3.5 million THB. Price growth in both areas has been more moderate than on the western coast - we estimate 4-6% y/y through 2025. Rawai's tenant base skews toward long-term residents and digital nomads, which reduces seasonal volatility but also compresses nightly rates relative to resort-facing districts.
Nai Harn presents a structural supply constraint worth noting: with only 2 projects currently under construction (anticipated delivery Q3-Q4 2026), secondary-market prices could accelerate over a 3-5 year horizon as inventory remains tight. We verify progress on both sites directly - as of March 2026, one is in finishing works and the other is at structural frame stage.
Scenario 3: end-use buyer seeking a prestige address
Layan and Surin carry the highest per-square-metre prices on the island and the highest ambient standard of infrastructure. Layan, with its long calm beach and proximity to several of Phuket's most recognised hotel brands, draws affluent buyers from Europe, East Asia and the Gulf. New villa-segment projects in Layan open from 25 million THB per unit; condominium medians range from 145,000 to 185,000 THB per sq m.
Surin sits just below Layan on price - median approximately 130,000-160,000 THB per sq m - but offers marginally better restaurant density and beach access, which supports occupancy. Gross rental yield in both micro-markets is lower than elsewhere on the island, at our estimated 4.0-5.0%, because the elevated purchase price is not fully offset by proportionally higher rental rates.
Comparison table
| Parameter | Bang Tao | Layan | Kamala | Surin | Karon | Rawai | Nai Harn |
|---|---|---|---|---|---|---|---|
| Median price (THB per sq m) | 130,000-155,000 | 145,000-185,000 | 120,000-140,000 | 130,000-160,000 | 95,000-120,000 | 75,000-105,000 | 85,000-115,000 |
| Y/Y price growth (estimate) | 8-12% | 6-9% | 6-8% | 5-8% | 4-7% | 4-6% | 5-7% |
| Gross rental yield (estimate) | 5.5-7.0% | 4.0-5.5% | 5.5-7.0% | 4.5-5.5% | 5.0-6.5% | 4.5-6.0% | 4.5-5.5% |
| Peak-season occupancy | 70-78% | 65-72% | 72-78% | 70-75% | 68-75% | 55-65% | 58-68% |
| Low-season occupancy | 35-45% | 30-38% | 35-42% | 32-40% | 38-48% | 40-50% | 35-45% |
| Active construction sites | approx. 12 | approx. 5 | approx. 8 | approx. 4 | approx. 4 | approx. 10 | approx. 2 |
| Dominant tenant profile | premium tourists, families | premium tourists | premium tourists, families | premium tourists | budget and mid-range tourists | digital nomads, long-term residents | families, long-term residents |
All figures are indicative, based on our data sets as of Q1 2026.
Risks and mistakes
Over-reliance on developer-supplied yield figures. Developers in Phuket frequently advertise 'guaranteed returns' of 6-8% per year for 3-5 years. In our analysis we consistently check whether that guarantee is priced into the unit cost (effectively a discount repackaged as income) and whether the rental operator has the financial capacity to sustain payments through low-season periods. We recommend verifying the guarantee structure with an independent Thai lawyer before signing.
Underestimating holding costs. Common Area Maintenance (CAM) fees in new Phuket condominiums typically run 40-80 THB per sq m per month, and above 100 THB per sq m in premium projects. The one-time sinking fund payable at handover is generally 500-800 THB per sq m. In our modelling, these costs reduce effective net yield by approximately 0.5-1.5 percentage points relative to headline gross figures.
Regulatory exposure on short-term rentals. Thailand's Hotel Act requires a licence for any property rented for stays shorter than 30 days. Enforcement intensity varies by district and property manager. We monitor regulatory developments continuously - as of March 2026 no new regulations tightening short-term rental rules have been enacted, but the risk of future changes remains real and should be factored into long-term yield assumptions.
Buying on price per square metre alone without location analysis. Rawai is approximately 40-50% cheaper than Bang Tao per square metre, but peak-season occupancy is 15-18 percentage points lower. A lower entry price does not automatically compensate for structurally lower rental revenue over a holding period.
Currency exposure. Buyers whose home currency is not THB carry exchange-rate risk. In the 12-month window from March 2025 to March 2026, the THB moved within a range that, on a 5 million THB purchase, represented a variance of approximately 85,000 THB in equivalent foreign-currency terms. This is material enough to affect net return calculations and should be accounted for in any sensitivity analysis.
FAQ
Which Phuket district is the most affordable in 2026?
Based on our Q1 2026 data sets, Rawai carries the lowest median condominium asking price among the seven districts we track - approximately 75,000-105,000 THB per sq m.
What is the price per sq m in Bang Tao?
The median asking price for new condominiums in Bang Tao is approximately 130,000-155,000 THB per sq m as of Q1 2026. We estimate year-on-year price growth at 8-12%, making Bang Tao one of the fastest-appreciating districts on the island.
What gross rental yield can a Phuket condominium generate?
Across the seven districts we monitor, gross rental yield ranges from approximately 4.0% to 7.0% per year. The upper end (5.5-7.0%) is observed in Bang Tao and Kamala; the lower end (4.0-5.5%) in Layan and Nai Harn. Net yield after management fees, CAM and applicable taxes is typically 1.5-2.5 percentage points lower than the gross figure.
Is Layan a stronger investment than Surin?
Both operate in the premium segment. Layan has a higher entry price and fewer active projects (approx. 5 vs approx. 4 in Surin), which may support capital value growth over a 3-5 year horizon. Surin offers marginally better beach access and restaurant density, translating to slightly higher peak-season occupancy. The choice depends on the investor's primary objective: capital appreciation favours Layan, current rental income slightly favours Surin.
How many new projects are under construction in Phuket in 2026?
Across the seven districts in our coverage, we track approximately 45 active construction sites as of Q1 2026. The largest concentrations are in Bang Tao (approx. 12 projects) and Rawai (approx. 10). Nai Harn has the fewest new launches (2 projects, totalling approximately 120 units).
How does seasonality affect rental performance on Phuket?
Peak season (November through April) generates occupancy of 55-78% depending on district. Low season (May through October) brings that down to 30-50%. Rawai and Karon show the most stable year-round performance, partly because of a higher share of long-term tenants who are less sensitive to weather patterns.
Is Karon a viable location for a condominium purchase?
Karon offers a meaningful price-to-beach-proximity ratio, with a median of 95,000-120,000 THB per sq m and direct access to one of the island's longest beaches. Its constraints are a limited new-supply pipeline (4 active sites) and a historically more budget-oriented tourist profile than the west-coast premium districts. Low-season occupancy of 38-48% is relatively resilient compared to some northern districts.
What are the ongoing ownership costs for a Phuket condominium?
CAM fees typically run 40-80 THB per sq m per month in standard projects and above 100 THB per sq m in premium developments. The one-time sinking fund at handover is generally 500-800 THB per sq m. For a 45 sq m unit in a standard project, annual CAM costs work out to approximately 21,600-43,200 THB - a figure that must be deducted before calculating net yield.
How should an investor compare districts before committing?
Based on our analytical framework, we recommend comparing a minimum of three districts across three parameters simultaneously: price per sq m, estimated net yield, and the active new-supply pipeline. Price differences between Phuket districts reach up to 60% per square metre. That gap has a greater impact on investment outcome than finish quality or developer brand.
Researching property in Phuket or Koh Samui? Get in touch - our analysts will prepare a data brief for your shortlisted location.